4.9 KiB
Nezha Monitoring supports monitoring of server load, CPU, memory, hard disk, bandwidth, data transfer, monthly data transfer, number of processes, number of connections, and sends alarm notifications when one of these items reaches a user-set limit.
Flexible notification methods
#NEZHA# is the panel message placeholder, the panel will automatically replace the placeholder with the actual message when it triggers the notification
The content of Body is in JSON format:When the request type is FORM,the value is in the form of key:value,value can contain placeholders that will be automatically replaced when notified. When the request type is JSON It will only do string substitution and submit to the URL directly.
Placeholders can also be placed inside the URL, and it will perform a simple string substitution when requested.
Refer to the example below, it is very flexible.
-
Telegram Example, contributed by @haitau
- Name:Telegram Robot message notification
- URL:https://api.telegram.org/botXXXXXX/sendMessage?chat_id=YYYYYY&text=#NEZHA#
- Request method: GET
- Request type: default
- Body: null
- URL Parameter acquisition instructions:The XXXXXX in botXXXXXX is the token provided when you follow the official @Botfather in Telegram and enter /newbot to create a new bot. (In the line after Use this token to access the HTTP API). The 'bot' are essential. After creating a bot, you need to talk to the BOT in Telegram (send a random message) before you can send a message by using API. YYYYYY is Telegram user's ID, you can get it by talking to the bot @userinfobot.
Description of notification rules
Basic Rules
- Type: one or more types can be selected, such as in a rule to select more than one type, you need to meet all the selected types at the same time to trigger the notification (see the example later)
cpu、memory、swap、disknet_in_speedInbound speed,net_out_speedOutbound speed,net_all_speedInbound + Outbound speed,transfer_inInbound Transfer,transfer_outOutbound Transfer,transfer_allTotal TransferofflineOffline monitoringload1、load5、load15Loadprocess_countNumber of processes Currently, counting the number of processes takes up too many resources and is not supported at the momenttcp_conn_count、udp_conn_countNumber of connections
- duration:Lasting for a few seconds, the notification will only be triggered when the sampling record reaches 30% or more within a few seconds
- min/max
- Transfer, network speed, and other values of the same type. Unit is byte (1KB=1024B,1MB = 1024*1024B)
- Memory, hard disk, CPU. units are usage percentages
- No setup required for offline monitoring
- cover
[{"type":"offline","duration":10, "cover":0, "ignore":{"5": true}}]0Cover all, useignoreto ignore specific servers1Ignore all, useignoreto monitoring specific servers
For example:[{"type":"offline","duration":10, "cover":0, "ignore":{"5": true}}]
- ignore: Select to ignore specific servers, use with
coverwith server id and boolean, e.g.:{"1": true, "2":false}
Complete examples:
:::tip
Add an offline notification
- Name: Offline notification
- Rules:
[{"Type":"offline","Duration":10}] - Enable: √ :::
:::tip
Add an notification when the CPU exceeds 50% for 10s but the memory usage is below 20% for 20s
- Name CPU and RAM
- Rules:
[{"Type":"cpu","Min":0,"Max":50,"Duration":10},{"Type":"memory","Min":20,"Max":0,"Duration":20}] - Enable: √
:::
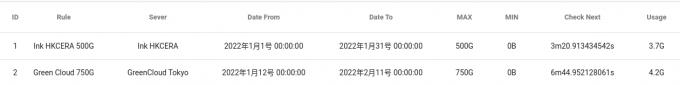
Special: Any-cycle transfer notification
Can be used as monthly transfer notificatin
-
type
transfer_in_cycleInbound transfer during the cycletransfer_out_cycleOutbound transfer during the cycletransfer_all_cycleThe sum of inbound and outbound transfer during the cycle
-
cycle_startStart date of the statistical cycle (can be the start date of your server's billing cycle), the time format is RFC3339, for example, the format in Beijing time zone is2022-01-11T08:00:00.00+08:00 -
cycle_intervalInterval time cycle (For example, if the cycle is in days and the value is 7, it means that the statistics are counted every 7 days) -
cycle_unitStatistics cycle unit, defaulthour, optional (hour,day,week,month,year) -
min/max,cover,ignorePlease refer to the basic rules to configure
Example: The server with ID 3 (defined in the ignore) is counted on the 15th of each month, and a notification is triggered when the monthly outbound traffic reaches 1TB during the cycle. [{"type":"transfer_out_cycle","max":1000000000000,"cycle_start":"2022-01-11T08:00:00.00+08:00","cycle_interval":1,"cycle_unit":"month","cover":1,"ignore":{"3":true}}]